On Thursday, the California Department of Education (CDE) published online school accountability results for Fall 2017 on its updated CA School Dashboard.
LEUSD improved in several areas, though English Language Arts and Math growth indicators are little changed from a year ago. In comparison, growth statewide was relatively flat, as current year results do not match statewide gains reported last year.
Superintendent Doug Kimberly said, “The Dashboard highlights improvements such as growth in English Learner progress and graduation rates, but to make the most of the Fall 2017 results, we must engage parents and teachers about ways to grow achievement in all student groups.”
The Dashboard provides teachers and principals with valuable performance data and reports, which teachers examine weekly during PLC collaboration time, and use to guide instruction.
Compared to California’s previous accountability system built on one measure (API), the power of the new Dashboard is like having broadband instead of “dial up”—the new Dashboard tracks multiple indicators with greater precision, for more insightful progress reports for schools and districts. The Dashboard provides more in-depth tools for teachers, parents and stakeholders to apply to student learning than the state’s previous single-score accountability system.
Below summarizes CA Dashboard Fall 2017 results for LEUSD. Five color codes are the result of status and change computations depicting achievement growth ranging from Blue (highest) to Red (lowest). District wide performance indicators include the following:
SUSPENSION RATES—by lowering suspensions, results for the 'Suspension' indicator have IMPROVED from orange to yellow, changing from a high suspension rating to a medium suspension rating.
‘EL’ PROGRESS—English Learners IMPROVED from yellow to green, changing from 'Medium' to 'High' as a result of an additional 3.1% students making progress towards English proficiency.
GRADUATION RATE—this indicator has IMPROVED from green to blue. The District continues to have a 'High' rating due to an increase in graduating students of 1.5%.
COLLEGE/CAREER PREPAREDNESS—growing College & Career Preparedness is an area for increased attention. The CA School Dashboard shows 35.2% of LEUSD graduates as being 'Prepared.” The State will not have a color indicator for College & Career Preparedness until 2018, but notably, LEUSD 11th grade students' ELA and Mathematics scaled scores increased in both areas respectively by 0.3 points and 4.2 points, a positive college readiness indicator.
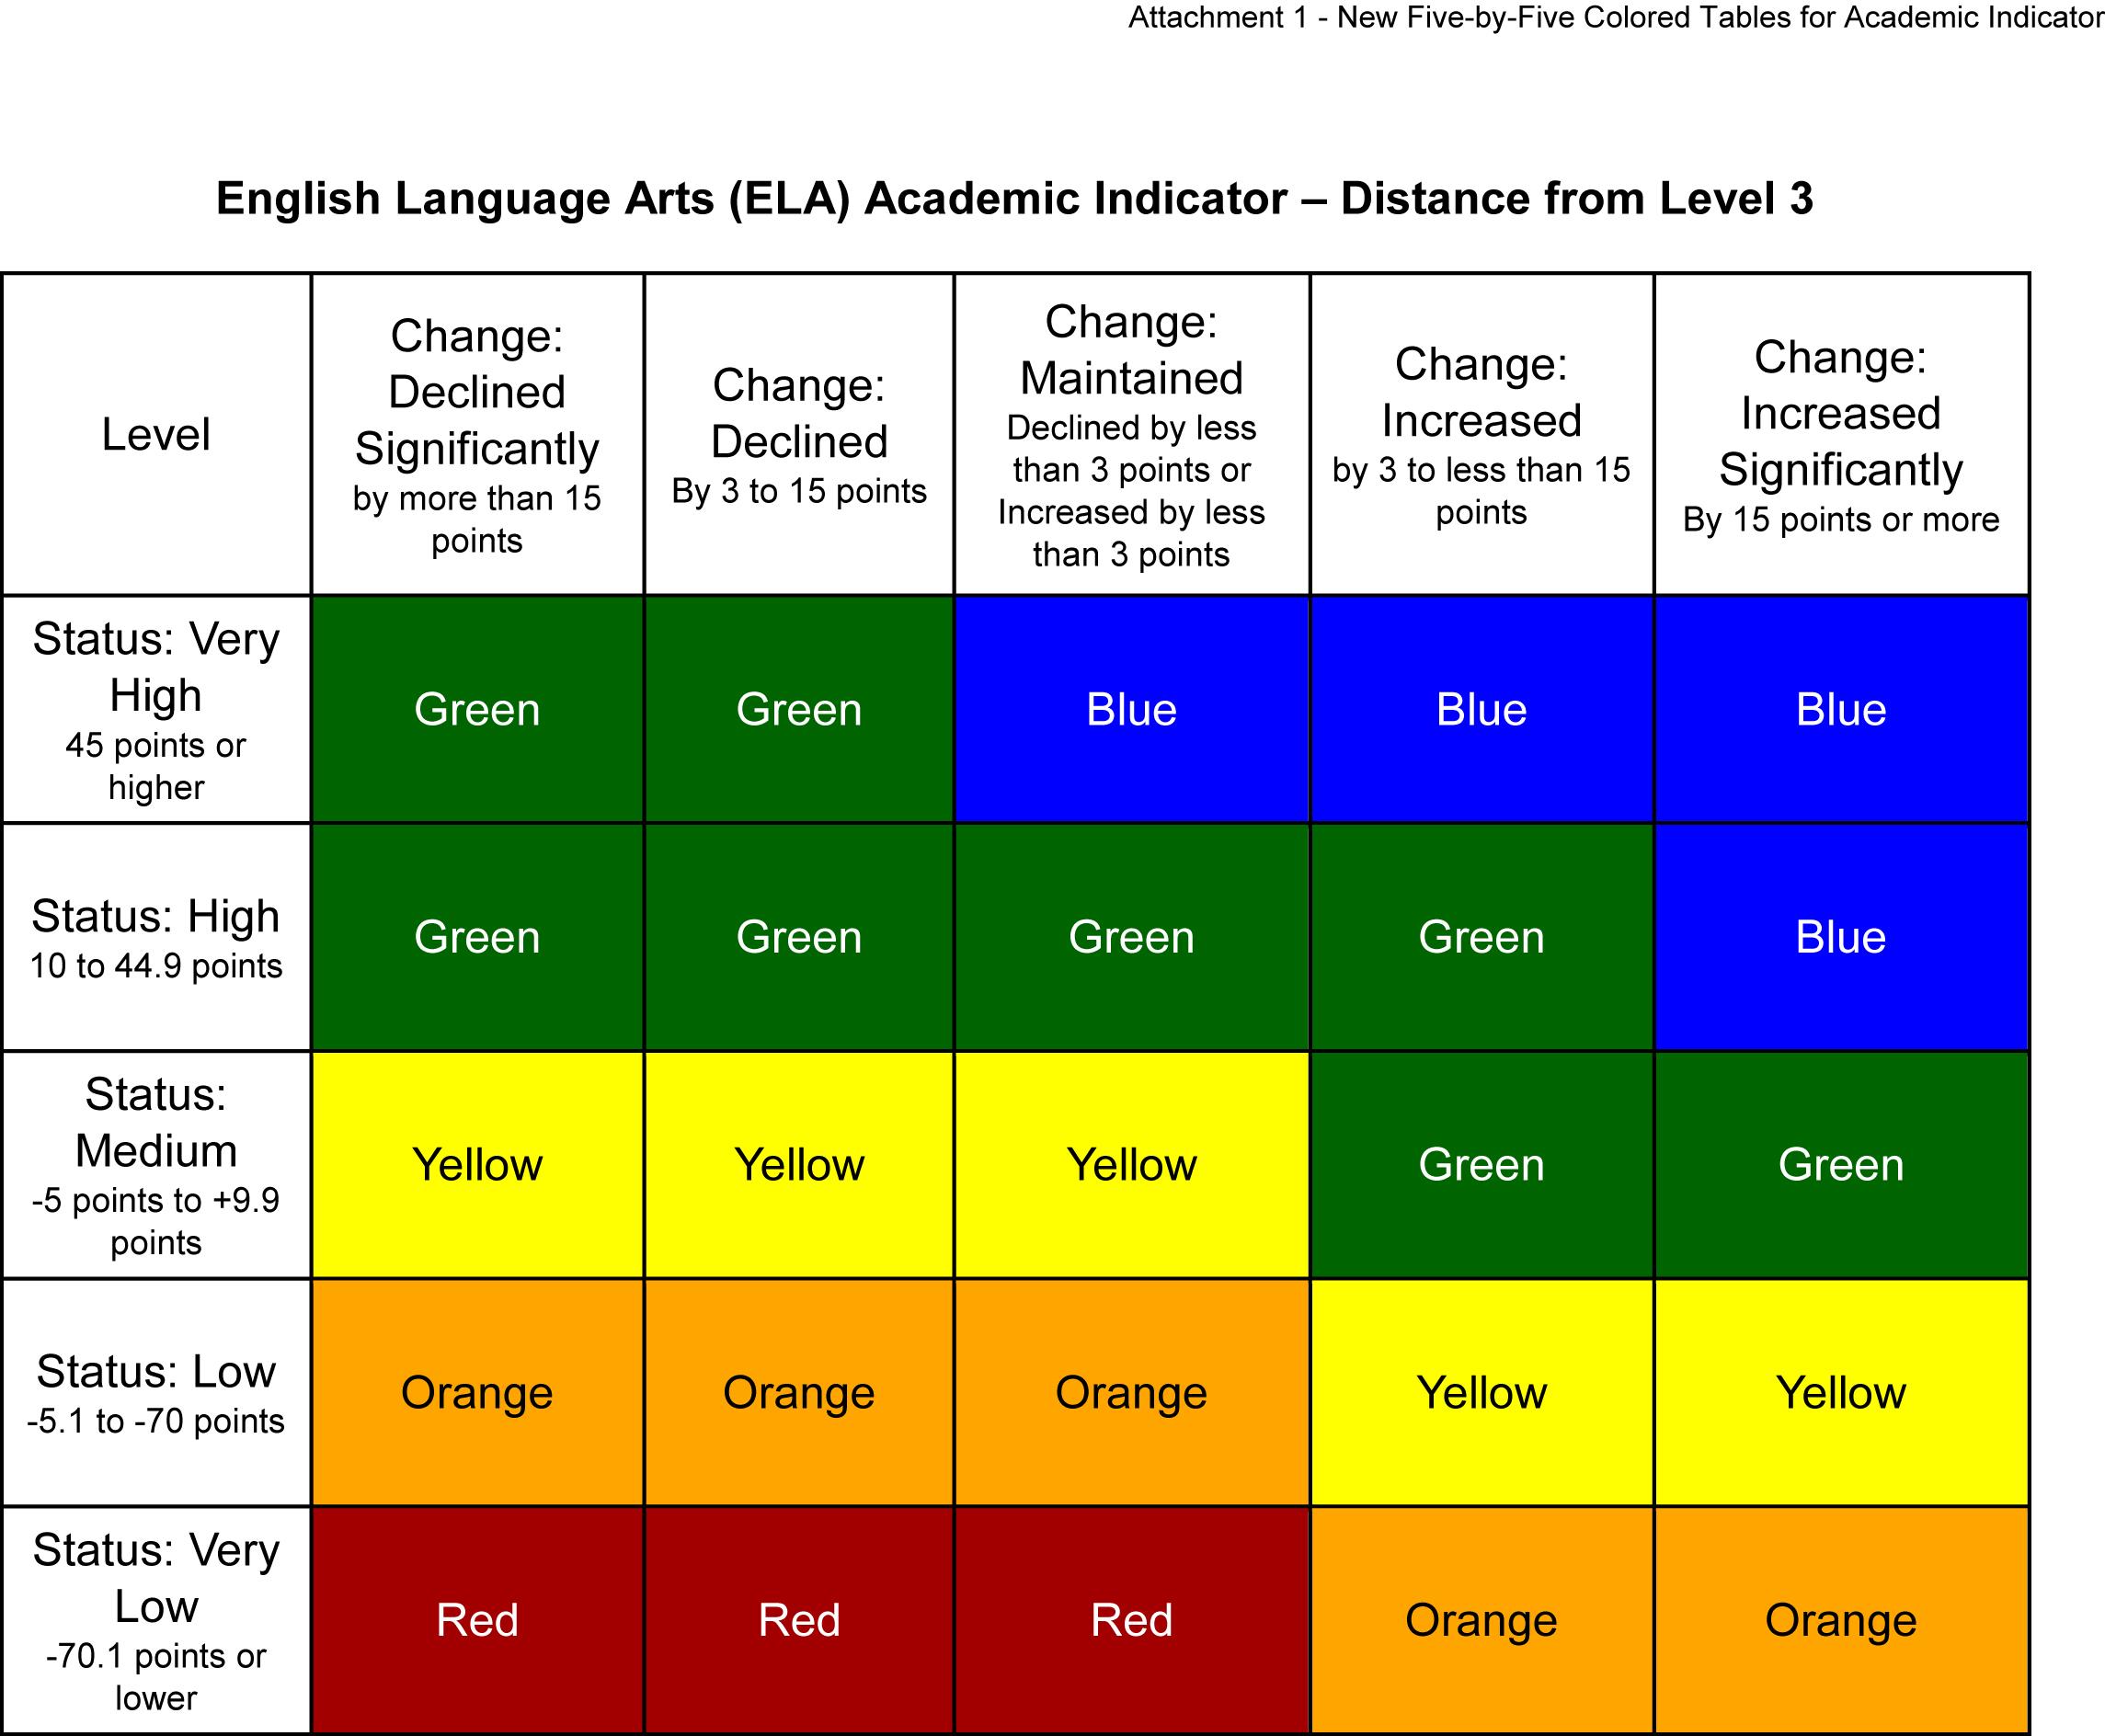
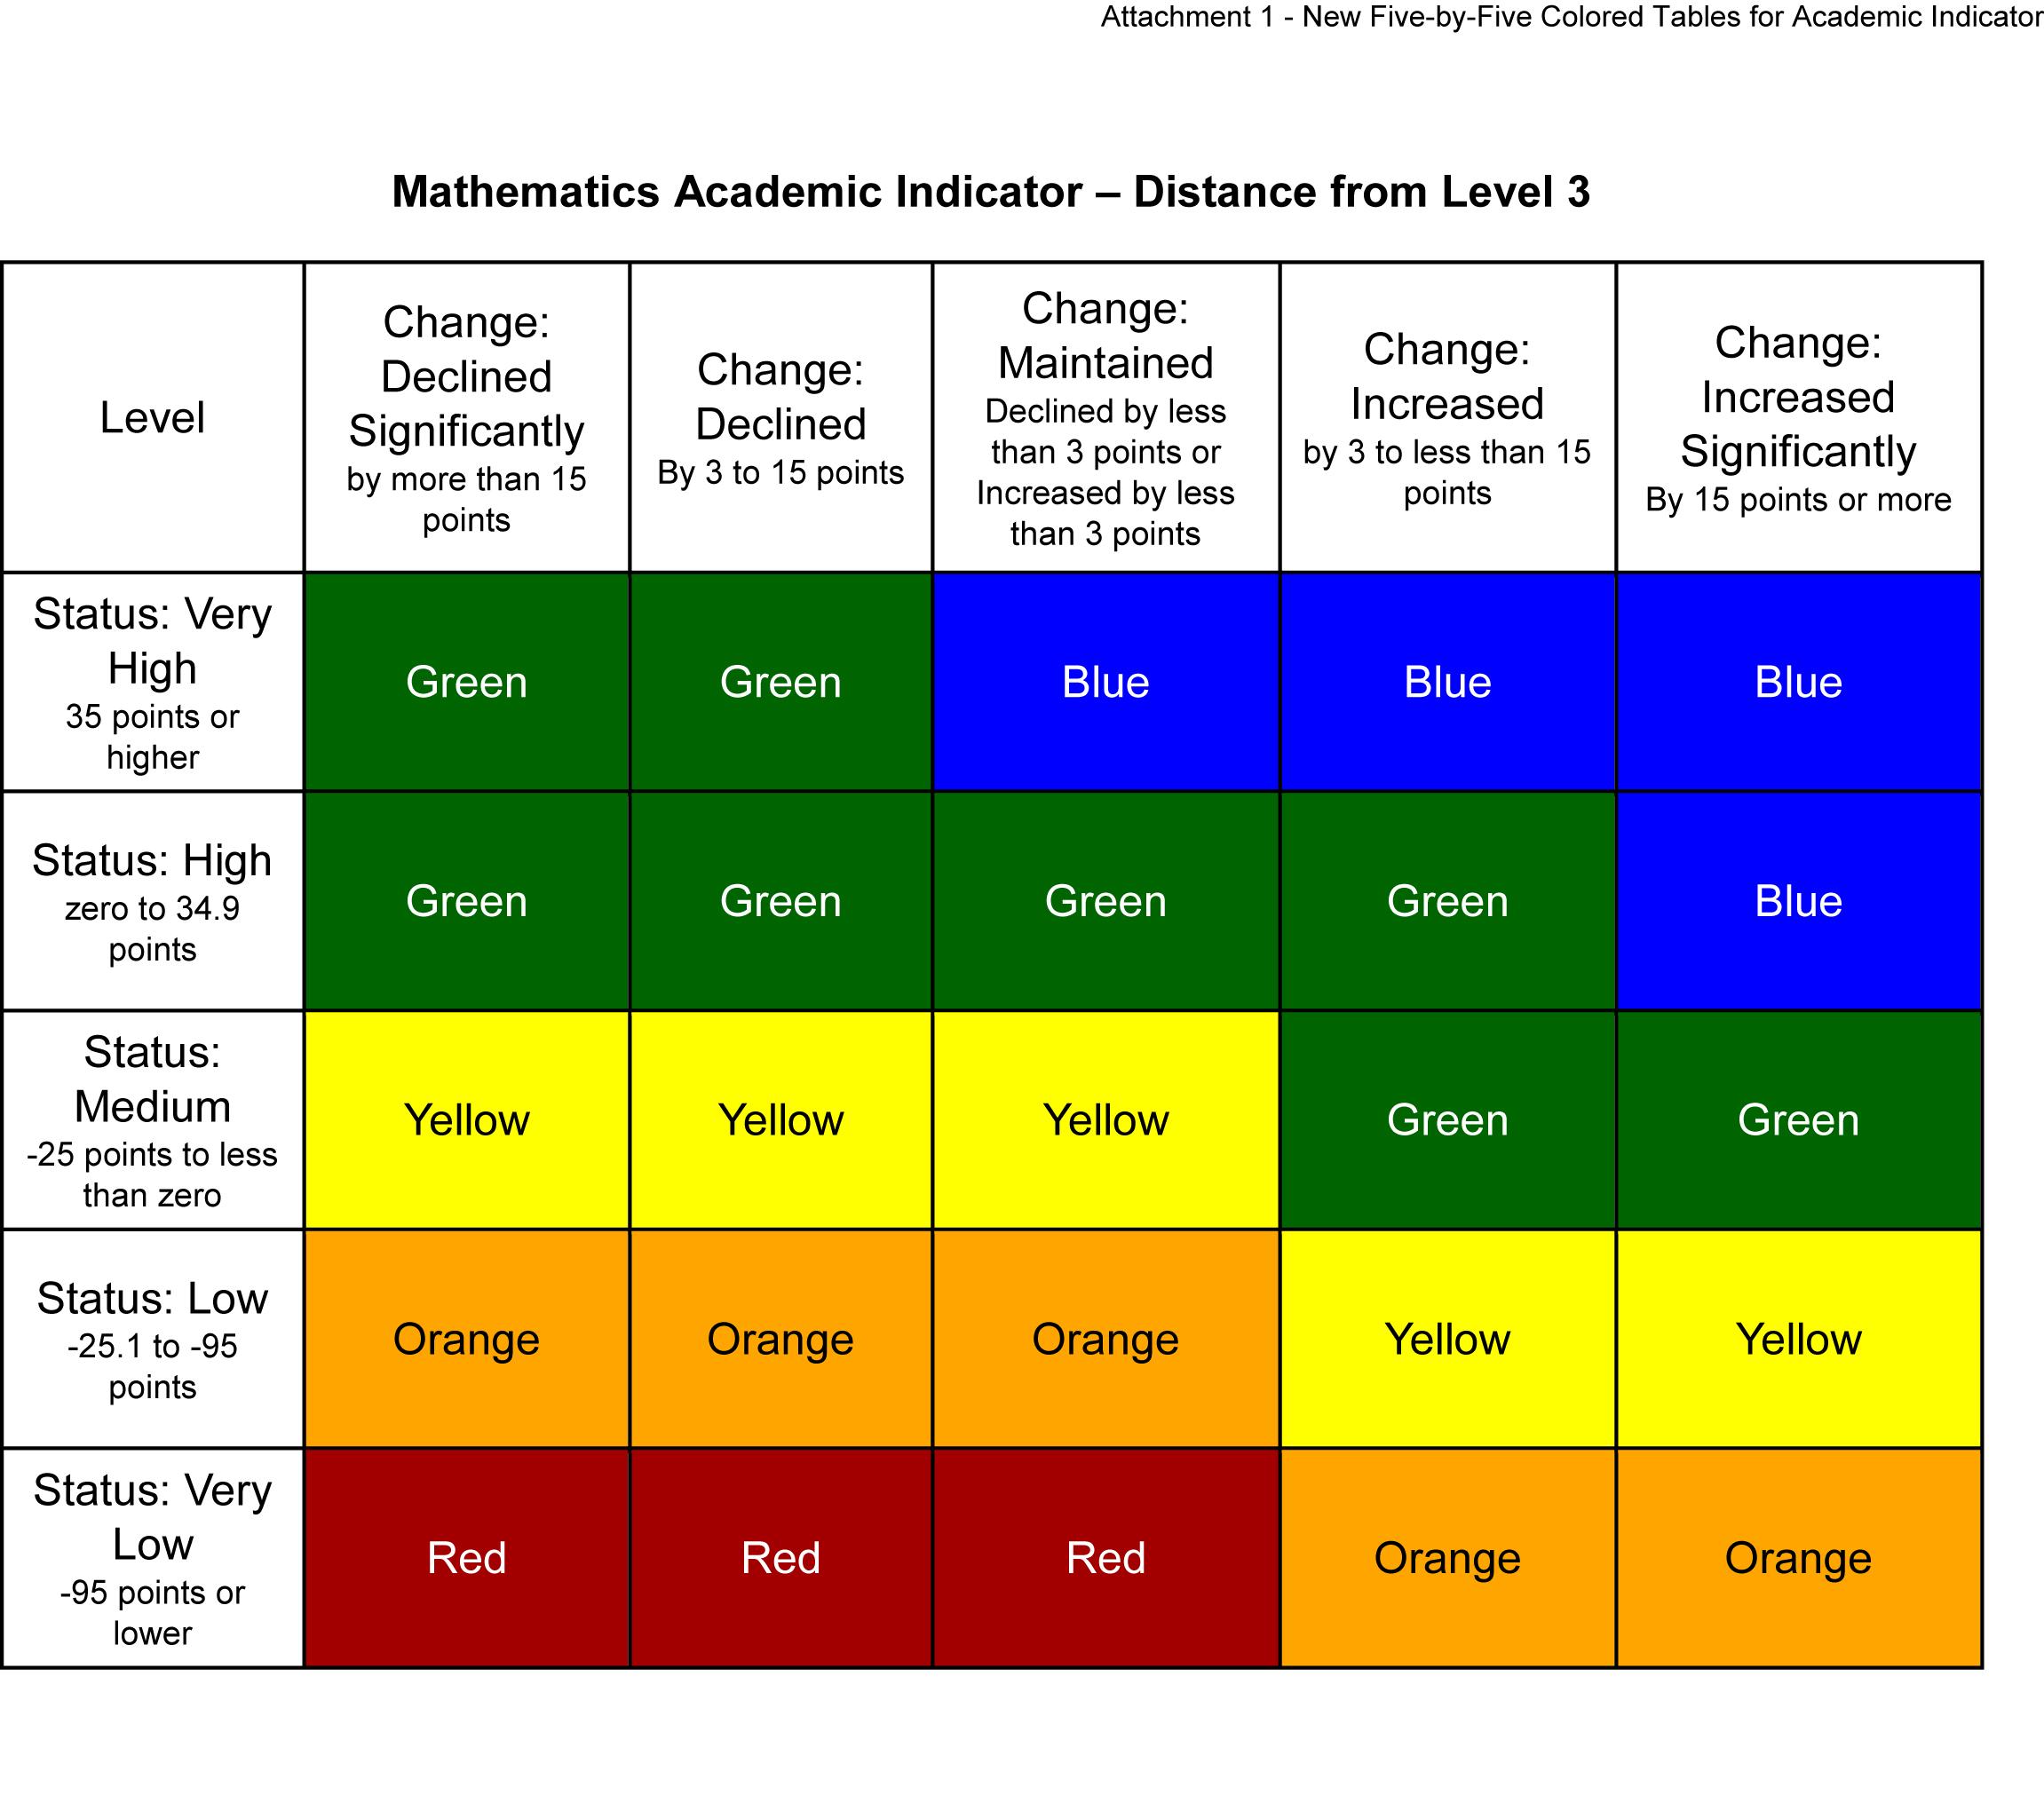
“FIVE BY FIVE” GRID REPORT—District wide 3rd - 8th grade students' scaled test scores for English Language Arts (ELA) decreased by 1.3 points (Fig. 1), while their Mathematics scaled scores increased by 1.3 points (Fig. 2). Since growth indicators for ELA and Mathematics stayed below three points of change, LEUSD’s ELA and Math results on the five by five report appear beneath the column heading Change: Maintained at Status Level: Orange.
“DISTANCE FROM LEVEL 3” (DF3)—this is the State’s new methodology for computing the average scale score that a school or student subgroup would have to reach for a “Standards Met” or Level 3 score. For example, in Figures 1 and 2 above, LEUSD is currently “in the orange”; progressing to the yellow requires ELA and math scale scores to go up anywhere between 3 to 15 points. Teachers and principals can use the DF3 scale score as a guide for targeting resources such as intervention to students in subgroups and in classroom instruction, to ensure steady progress.
CHRONIC ABSENTEEISM—for the first time, the CA Schools Dashboard includes District and school Chronic Absenteeism rates, though a Chronic Absenteeism color indicator does not appear on the Fall 2017 report. District wide, LEUSD’s Chronically Absent statistic is 12.8%.
A staff presentation on the Fall 2017 CA Schools Dashboard is on the agenda for the School Board meeting of Thursday, December 14, 2017. The 6:00 p.m. session is open to the public.
####